Last year I went to the D23 Expo in Anaheim, California. This was a conference for Disney fans everywhere. I got to attend panels where I learned past Disney secrets and upcoming Disney plans. I went purely for myself, since I love Disney everything, and I never dreamed I would learn something that could be applicable to my evaluation practice.
In a session with John Lasseter, Andrew Stanton, Pete Doctor, and others from Pixar, I learned about a technique created by Ralph Eggleston (who was there too) called color scripting. Color scripting is a type of story boarding, but Ralph would change the main colors of each panel to reflect the emotion the animated film was supposed to portray at that time. It helped the Pixar team understand what was going on in the film emotionally at a quick glance, and it also made it easier to create a musical score to enhance those emotions.
Then, a few weeks later, I was sitting in a large event for a client, observing from the back of the room. I started taking notes on the engagement and energy of the audience based on who was presenting. I created some metrics on the spot including number of people on their mobile devices, number of people leaving the event, laughter, murmuring, applause, etc. I thought I would create a simple chart with a timeline of the event, highlighting who was presenting at different times, and indicating if engagement was high/medium/low and if energy was high/medium/low. I quickly realized, when analyzing the data, that engagement and energy were 100% related. If engagement was high, then energy followed shortly as being high. So, instead of charting two dimensions, I really only needed to chart one: engagement & energy combined (see definitions of engagement and energy in the graphic below). That’s when it hit me – color scripting! Okay, I’m no artist like Ralph Eggleston, so I created a simple color scheme to use.
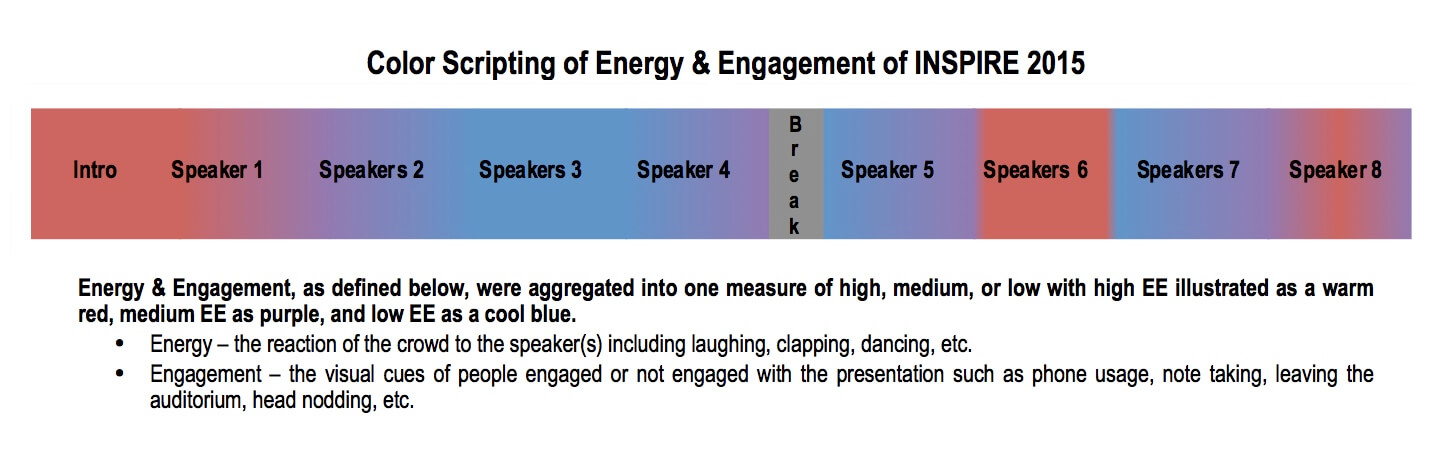
In sharing this with the clients who put on the event, they could clearly see how the audience reacted to the various elements of the event. It was helpful in determining how to improve the event in the future. This was a quick and easy visual, made in Word, to illustrate the overall reactions of the audience.
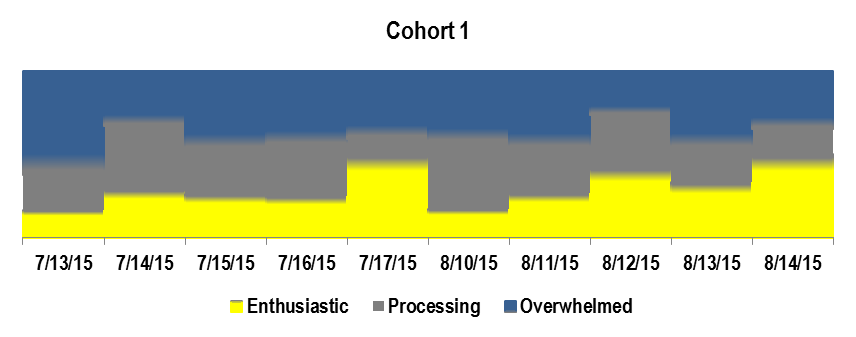
I have since also applied this to a STEM project, color scripting how the teachers in a two-week professional development workshop felt at the end of each day based on one word they shared upon exiting the workshop each day. By mapping participant feelings in the different cohorts and comparing what and how things were taught each day, this resulted in thoughtful conversations with the trainers about how they want the participants to feel and what they need to change to match reality with intention.
You never know where you’re going to learn a technique or tool that could be useful in your evaluation practice and useful to the client. Be open to learning everywhere you go.

Wendy Tackett
President, iEvalDr. Wendy Tackett has a background in writing and managing grants, working in public education and nonprofits, and evaluating at the practitioner level, which helps her understand the challenges educational institutions and nonprofits face and work with them in a participatory manner. She earned her doctorate from Western Michigan University in Evaluation, Measurement, and Research Design. Dr. Tackett is skilled in both quantitative and qualitative data collection and analysis methods, focusing heavily on the use of evaluation findings. Dr. Tackett founded iEval, an evaluation consulting firm, in 2002 and can be contacted at wendy@ieval.net.

Except where noted, all content on this website is licensed under a Creative Commons Attribution-NonCommercial-ShareAlike 4.0 International License.