

With any initiative, it can be valuable to document and describe the implementation to understand what occurred and what shifts or changes were made to the original design (e.g., fidelity to the model). This understanding helps when replicating, scaling, or seeking future funding for the initiative.
Documentation can be done by the evaluator and be shared with the grantee (as a way to validate an evaluator’s understanding of the project). Alternatively, project staff can document progress and share this with the evaluator as a way to keep the evaluation team up to date (which is especially helpful on small-budget evaluation projects).
The documentation of progress can be extremely detailed or high level (e.g., a snapshot of the initiative’s development). When tracking implementation milestones, consider:
- What is the goal of the document?
- Who is the audience?
- What are the most effective ways to display and group the data?
For example, if you are interested in understanding a snapshot of milestones and modifications of the original project design, you might use a structure like the one below:
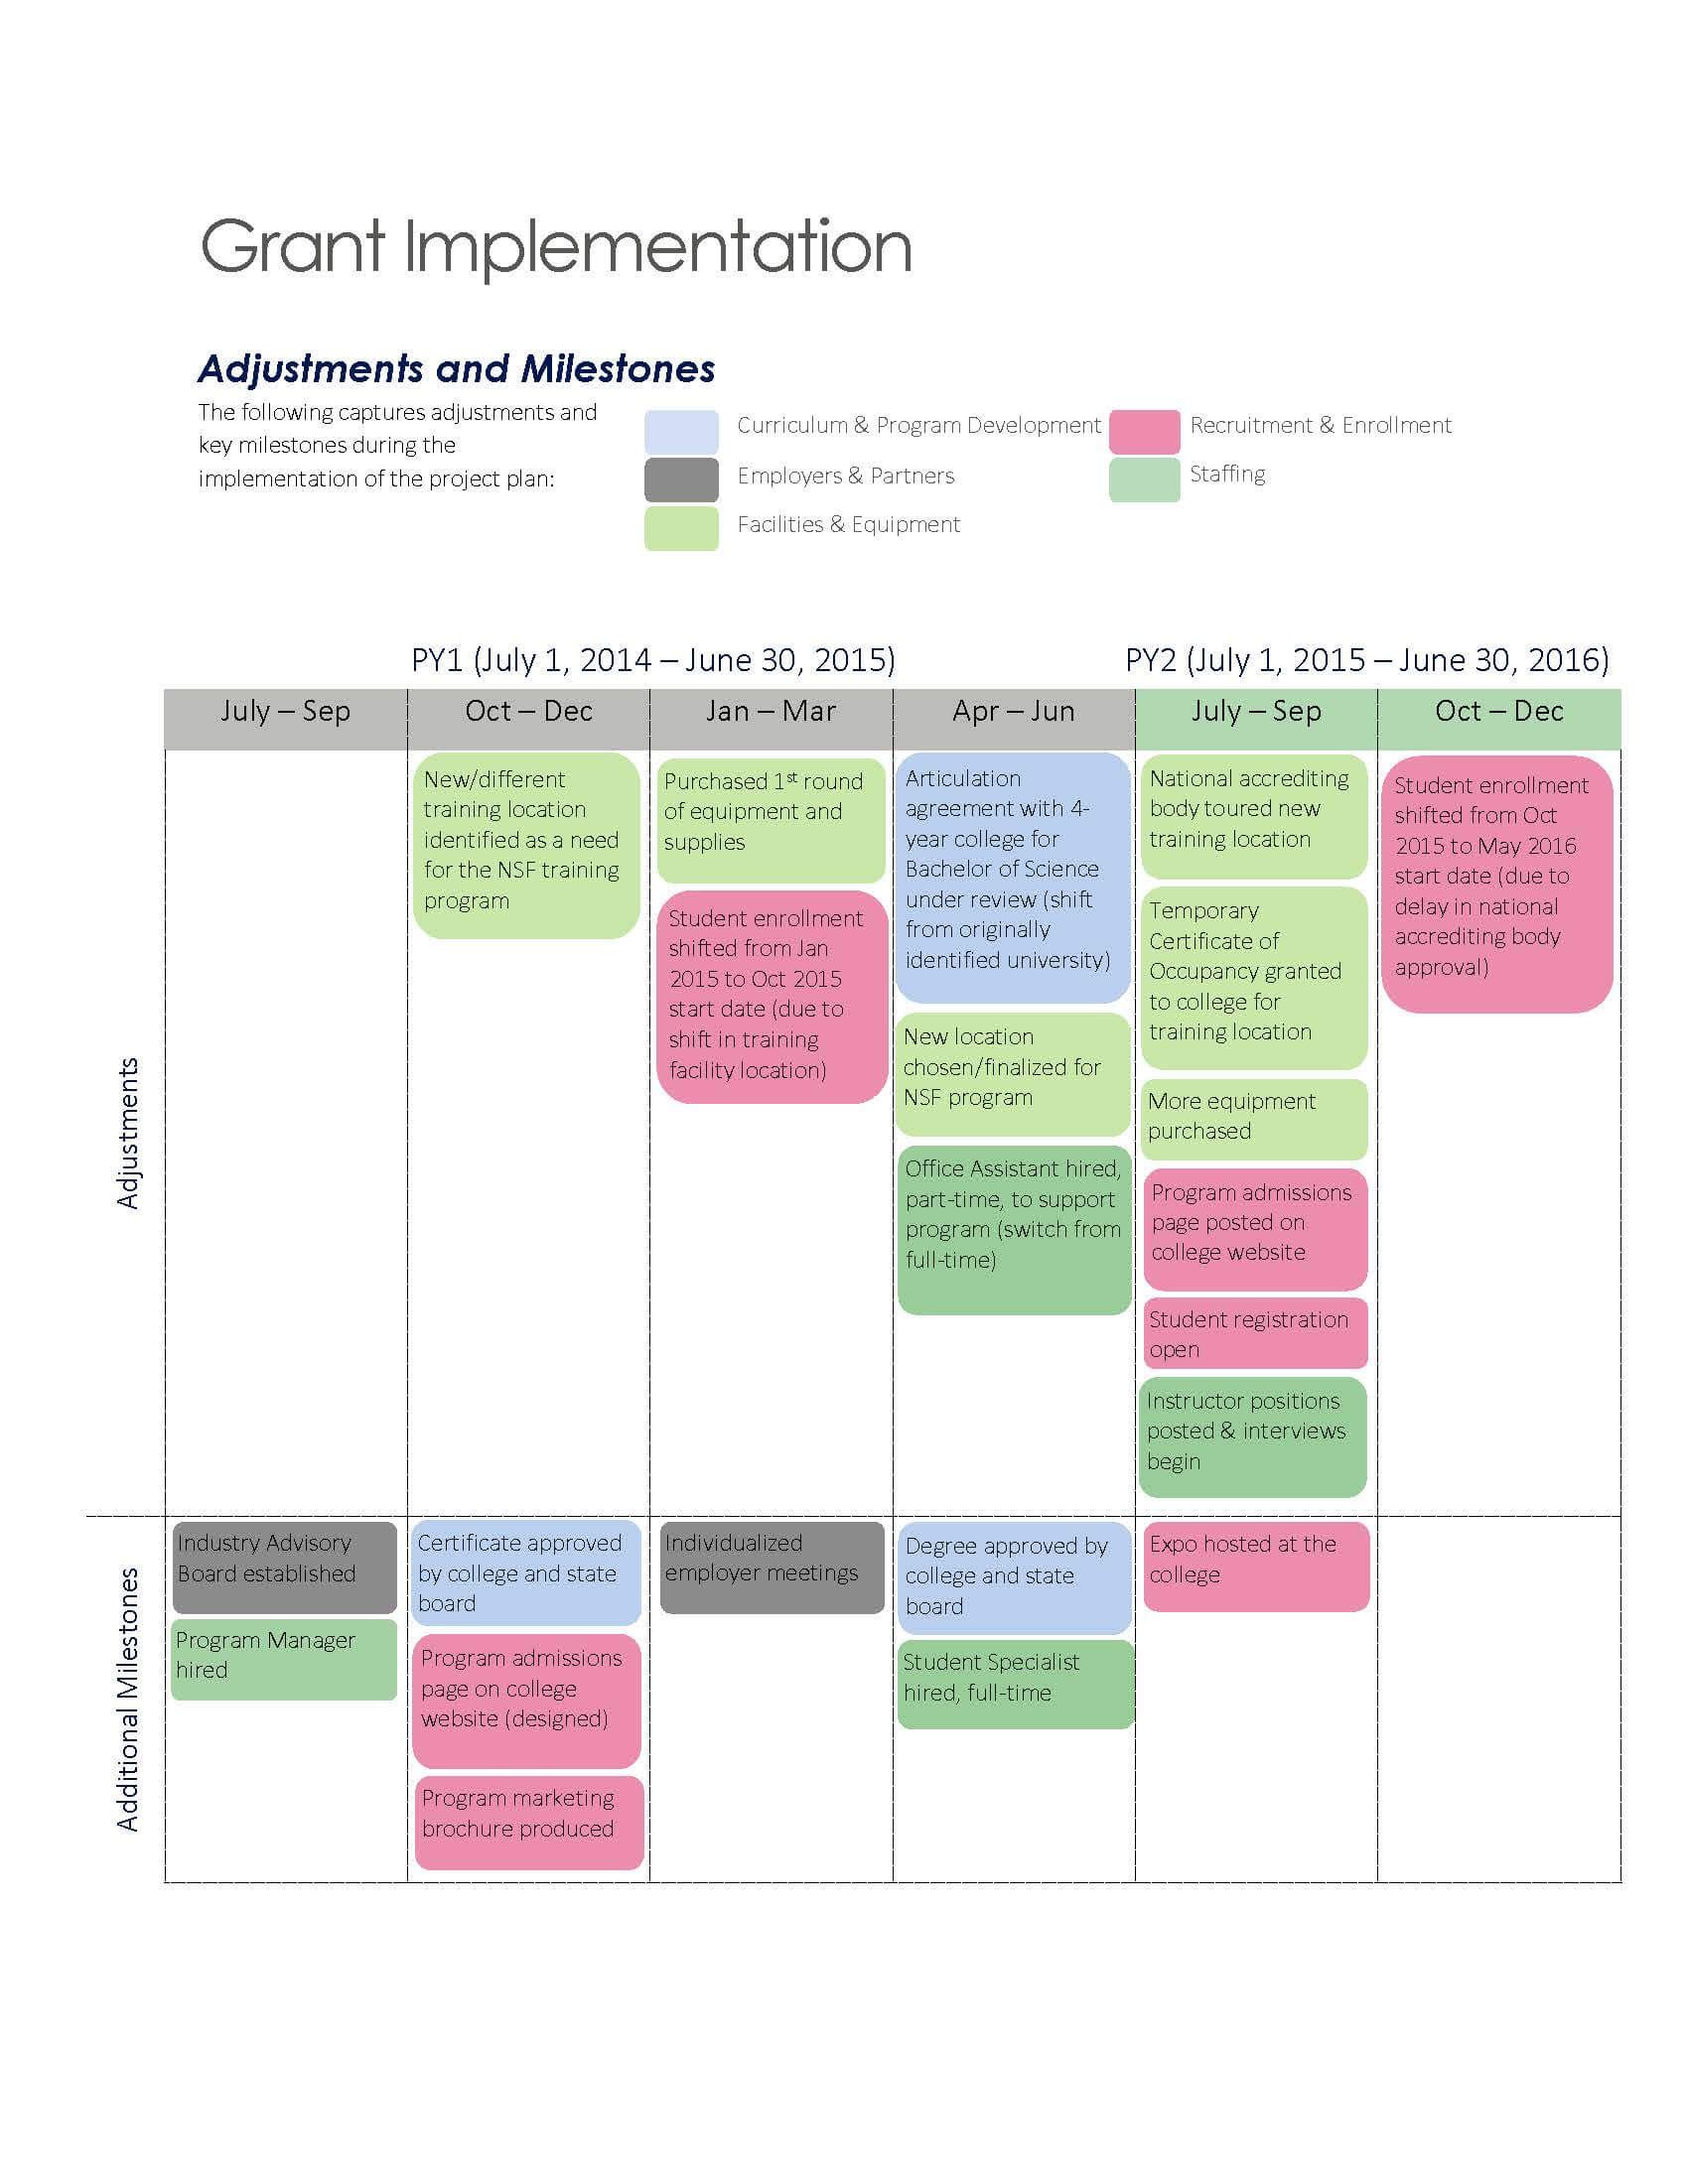
If you are especially interested in highlighting the effect of delays on project implementation and the cause, you may adjust the visual to include directional arrows and shading:

In these examples, we organized the snapshot by quarterly progress, but you can group milestones by month or even include a timeline of the events. Similarly, in Image 2 we categorized progress in buckets (e.g., curriculum, staffing) based on key areas of the grant’s goals and activities. These categories should change to align with the unique focus of each initiative. For example, if professional development is a considerable part of the grant, then perhaps placing that into a separate category (instead of combining it with staffing) would be best.
Another important consideration is the target audience. We have used this framework when communicating with project staff and leadership to show, at a high level, what is taking place within the project. This diagramming has also been valuable for sharing knowledge across our evaluation staff members, leading to discussions around fidelity to the model and any shifts or changes that may need to occur within the evaluation design, based on project implementation. Some of your stakeholders, such as project funders, may want more information than just the snapshot. In these cases, you may consider adding additional detail to the snapshot visual, or starting your report with the snapshot and then providing an additional narrative around each bucket and/or time period covered within the visual.
Also, the framework itself can be modified. If, for example, you are more concerned about showing the cause and effect instead of adjustments, you may group everything together as “milestones” instead of having separate categories for “adjustments” and “additional milestones.”
For our evaluation team, this approach has been a helpful way to consolidate, disseminate, and discuss initiative milestones with key stakeholder groups such as initiative staff, evaluators, college leadership, and funders. We hope this will be valuable to you as well.

Jennifer Bellville
Evaluation Specialist, Thomas P. Miller & AssociatesJennifer Bellville is an evaluation specialist at Thomas P. Miller & Associates and is engaged in the design and implementation of qualitative and mixed-methods evaluations. Jennifer specializes in creating customized evaluation approaches that help organizations obtain the data and knowledge they need to make strategic decisions, deliver their programs more effectively, and communicate their impact to a variety of audiences. She supports organizations by collaboratively developing methodology frameworks, accessible reports, and continuous improvement feedback loops. Jennifer works with community colleges, universities, workforce boards, and nonprofits across the nation that receive funding from the federal government and foundations.

Except where noted, all content on this website is licensed under a Creative Commons Attribution-NonCommercial-ShareAlike 4.0 International License.